After our adventures in Quebec and Greenland, it was now time for our last stop in this intense season of fieldwork. This time we were heading to the Canadian Northwest Territories (NWT). Extraordinary wildfire seasons have become a regular occurrence in the NWT. The territory’s 10-year average for the total number of fires was exceeded in 2022, with nearly 600,000 hectares burned in 256 fires. At the time, that was more than any year since the outlier season of 2014. This may seem like a lot, but 2023 was brutal and far more exceptional.
The 2023 record fire season totaled around 3.6 million hectares burned by 303 fires. About 70 percent of the territory’s population, including the capital Yellowknife, was evacuated in the summer of 2023. The current Canadian fire season is also shaping up to be one of the most extreme in the last two decades. These extreme fire seasons have a significant impact on carbon emissions into the atmosphere. In response, our goal for this campaign was to obtain critical field observations to better estimate these emissions, so we packed our bags one last time for this summer and traveled as far north as Inuvik to begin our final data collections.
Despite the significant advances in understanding carbon emissions from boreal forest fires in recent years, there are still substantial gaps in our knowledge when it comes to high-latitude tundra fires. Field-based carbon combustion measurements from tundra fires are scarce, and although these fires have historically been less frequent than those in boreal forests, they can be substantial due to the availability of carbon-rich organic soils in these regions. Part of our team on this expedition has previous field experience with tundra fires, and we know that tussocks can be used as reference points to estimate how much of the soil organic layer was lost due to fire.

In 2023, a large tundra fire broke out near the town of Inuvik. North of the Arctic Circle, the fire is in a fairly remote area with no road or river access. So, we sampled this fire by helicopter in an effort to estimate and date carbon stocks and calculate the amount of carbon released into the atmosphere. Along the fire perimeter, we found different types of dominant vegetation in the tundra, ranging from the tussocks to shrublands and even sparsely treed areas.
The view of the northern landscape was mesmerizing from above! The rolling hills stretched endlessly across the horizon, while the striking polygonal soil patterns and distinctive pingos added to the captivating view. The tundra was dotted with lakes of various sizes and ancient riverbeds. With paleo specialists Atte Korhola and Jan Weckström accompanying us, we couldn’t resist the opportunity to sample a lake and study the historical fire record preserved in its sediments. We are grateful to the Aurora Research Institute and the local community for welcoming us.

After an intense week in Inuvik, our team hit the road again, this time heading south to the Scotty Creek Research Station, about 50 kilometers from Fort Simpson. We began our journey from Yellowknife to Fort Simpson, uncertain whether the ongoing fires would allow us to travel. The smell of smoke was overwhelming, and the sight of the recently burned forest along the road was stark. Along the gravel road to Fort Simpson, we encountered bison, sampled some peatlands, and spent an hour waiting for a ferry. In the evening, we watched as the moon took on an intense red hue, tinted by the smoke particles in the air.
The next morning, we boarded a floatplane from the Mackenzie River to the Scotty Creek Research Station, where a friendly crew gave us a warm welcome. The research station is so isolated that it’s only accessible by plane. The creek, where the station is located, drains a 152-square-kilometer area of boreal forested peatland. Due to the permafrost in the region, significant thawing has transformed parts of the landscape from forested permafrost to treeless wetlands. In October 2022, the station suffered massive damage from an extraordinary late-season wildfire that raged for nearly 100 days before finally reaching the camp. The research station had just reopened during our stay there. This is good news for the entire scientific community, given the importance of this unique site in the heart of the boreal forest.

The goal of our Scotty Creek campaign was to sample the effects of fires on peatland ecosystems, aiming to better understand the climate change implications of wildfire in this fire-sensitive landscape. We spent three days in the field, sampling key ecosystems from sunrise until sunset.
A special shoutout goes to the station crew, whose professionalism made everything run smoothly. After long days of work, returning to camp was a treat, especially with our hosts preparing dinner for us. We’ll never forget their hospitality—thank you, Scotty Creek team!

And so, our journey comes to an end. It was a summer to remember, one filled with hard work but also moments of joy and discovery. People will read this post, and in the near future, others will study the findings of our field research. Our results may be cited and applied by fellow scientists. Yet, no data or paper can truly capture what this season of fieldwork was like. Only we hold those memories. The months of preparation that preceded the trip: developing research protocols, selecting sites, navigating logistics, and endless paperwork. The long hours driving both paved and dirt roads. Fieldwork under the scorching sun, and other days when cold rain chilled us to the bone. The relentless mosquitoes. Simple lunches in the field contrasted with the risotto made from mushrooms foraged at burned sites. The flat tire. The cracked car window. Lost pens. Inventorying more than 400 trees in a single plot. Charcoal covering our hands and faces day after day. Setting up camp in incredible, remote places. The joy of plunging into a cold lake after a hard day of work. Spontaneously stopping the car on our day off because the excitement of sampling two more sites was too hard to resist. Unexpectedly gaining four extra days in Greenland due to a canceled flight. Swimming in the frigid waters of a fjord. Climbing to the summit of a mountain.
We have had the privilege of visiting places most people will never see, and for that, we are deeply grateful. This chapter of fieldwork for our Ph.D. research is over, but the Arctic continues to warm, and intense fire seasons in these regions are here to stay. We are eager to better understand the complex interactions between these changes and Arctic-boreal fires. As we return home, our suitcases packed with data, the time for analyses begins—now from our offices, but with this field season always on our minds.

The NWT fires expedition was organized within the Research Council of Finland Academy Research Fellow project “Fire in the Arctic,” led by Meri Ruppel, and the Kone Foundation project FLARE. The fieldwork was also part of FireIce (Fire in the land of ice: climatic drivers & feedbacks), a Consolidator project led by Sander Veraverbeke and funded by the European Research Council. FireIce is affiliated with NASA’s Arctic-Boreal Vulnerability Experiment (ABoVE).
This blog post was co-written by Lucas R. Diaz, a Ph.D. student at Vrije Universiteit Amsterdam, and Sonja Granqvist, a Ph.D. student at the University of Helsinki, both studying Arctic-boreal fires.

Research Vessel (RV) Blissfully is a 30-foot sailboat that is the science lab and home for two sailing scientists, Captain Gordon Ackland and myself, Dr. Bridget Seegers. The RV Blissfully is a recent addition to the fleet of research vessels. Previously, Blissfully’s days were primarily spent peacefully floating snug in a San Diego boat slip with an occasional day sail. However, Blissfully was volunteered to support the PACE-PAX campaign and therefore transitioned a month ago into RV Blissfully.

In five slightly stress-filled days, research gear was loaded, Blissfully’s sitting area became a lab, and cables and instruments ready for deployment were hung from the stern. The goal is to gather ocean data for the validation of data from the exciting new PACE satellite. Now, RV Blissfully spends eight to 10 hours a day sailing for science.
Days on RV Blissfully begin in harbor with an alarm waking our sleeping research team. A thermos is quickly filled with coffee and poured into RV Blissfully crew mugs. Some mornings before departing, Bridget does video visits with classrooms of 4th and 6th graders, answering their questions about the ocean and life as a scientist.
Then, the dock lines are tossed, and a 2.5-hour morning commute begins. Leaping dolphins are frequently spotted along the way, and once a pair of fascinating mola molas were observed “swimming” along the surface.
The commute is also breakfast time, typically with yogurt, granola, and fruit.

A crew of two means everyone onboard fills many roles, including galley chef along with scientist, mechanic, and captain. The destination, 12 miles (20 kilometers) south, is an oil rig that is home to additional research instruments whose data will be combined with RV Blissfully’s data for a more complete picture of conditions in the atmosphere and ocean. The location is also a flyover target for the ER-2 and Twin Otter research planes, allowing for even more data sets for PACE validation.

Once on station, a bucket is tossed and 10-liters of water is gathered for a variety of samples, which are processed below deck. These water samples are filtered and frozen at -320ºF (196ºC) in liquid nitrogen or preserved in jars for further analysis when shipped back to the Ocean Ecology Lab at NASA’s Goddard Space Flight Center. The analysis will produce data about the community of microscopic ocean organisms like phytoplankton and bacteria that are critical to understanding our ocean. Bridget takes the lead on the water filtering, and because the lab bench used to be a couch, it is literally at knee-height, and therefore she spends much time working on her knees.

Meanwhile on the stern, Gordon is measuring ocean light with an instrument called a HyperPro—he’s a real pro with the HyperPro.

Once logging begins, he lets the instrument fall to a depth of 20 meters before hauling it up to the surface and letting it descend again to 20 meters. This is repeated 15 times at each station, and the final cast goes to 60 meters to explore the ocean light further below. The HyperPro is critical for PACE validation because it measures light like the PACE Ocean Color Instrument, so it allows scientists to compare measurements from the ocean with light measured all the way in space.
The routine of collecting water samples and HyperPro profiles keeps the crew busy station after station.

Occasionally, the routine is broken by the spotting of wildlife or a wave through a porthole. The shifting waves and weather keep it interesting. The days are beautiful, exhausting, a bit tedious, and inspiring. All emotions fit onto RV Blissfully’s 30 feet out at sea. The winds pick up through the afternoon, so when the final station is done for the day, a sail is frequently raised for the return to harbor.
A sailboat significantly reduces the fuel used for research. RV Blissfully used 14 gallons of diesel over nine days of sampling, covering roughly 230 miles and providing data from 19 research stations. Eventually, RV Blissfully is docked, the instruments are rinsed, the crew wanders to shore for dinner as the sun sets, and after dinner they wander back to RV Blissfully for sleep—resting up to be ready for the rinse and repeat research routine to begin again.
This was the crew’s first sailing field campaign, and both Gordon and Bridget would like to do it again. They are grateful for all the friends, family, and colleagues whose support made it possible. Accomplishing PACE-PAX research on RV Blissfully made the sailing for science dream a reality.
]]>Thursday August 12, 2024: PACE-PAX Day 10 of 28
06:00 Local Time: Go/No-Go Meeting
We are in the field supporting PACE-PAX (Plankton, Aerosol, Cloud, ocean Ecosystem Postlaunch Airborne eXperiment), a multi-disciplinary mission that involves two aircraft—the NASA ER-2 and CIRPAS Twin Otter—and several mobile ocean assets, all helping to validate observations and data products from NASA’s new satellite observation platform, PACE. Our days typically start with an initial look at the weather in the area of operations and airport conditions during takeoff and landing. Both the ER-2 and Twin Otter will fly today since the weather is acceptable for launch, science, and landing.
07:45 Local Time: Tower Check-in
After breakfast at the hotel, our small team with a big name (LARGE, or the Langley Aerosol Research Group) heads to a semi-abandoned former control tower at the Marina Municipal Airport to check on a set of instrumentation operating 24/7 on the 7th floor. LARGE measures the properties of ambient aerosols, which are small particles in the atmosphere that can affect climate, seed clouds, and degrade air quality. Satellite observations quantify the sunlight scattered by particles to retrieve more complex properties like the particle concentration, size, and composition. For PACE-PAX, we are most interested in how those particles scatter and absorb light, making direct measurements—from the tower and on the Twin Otter aircraft—to provide a ground-truth for both the PACE satellite and for the satellite-proxy instrumentation on the ER-2.

09:00 Local Time: Pilot Pre-flight Briefing
Three hours prior to takeoff, the science team meets with the two pilots for the CIRPAS (Center for Interdisciplinary Remotely Piloted Aircraft Studies) Twin Otter aircraft to discuss the day’s flight plan. The Twin Otter is operated by the Office of Naval Research and has been flying missions like PACE-PAX since 1998. Today’s plan will focus on satellite retrievals of aerosol properties over turbid, complex surface waters. The Sacramento-San Joaquin River delta and San Francisco Bay area will be our areas of operation due to their close proximity to Marina and their biologically active and heterogenous waterways. During this meeting, we describe our goals for the flight, the route, and key decision points to enable a successful mission. Our plan today will have three spiral maneuvers between an altitude of 10,000 feet (the functional ceiling for the Twin Otter during PACE-PAX) and our minimum safe flying altitude, a low-altitude transect of the San Francisco Bay, and a low approach at Moffett Field at NASA Ames Research Center.

11:00 Local Time: Pre-flight Instrument Maintenance
Following the pilot briefing, the team goes out to the aircraft to start up instrumentation and replace consumables for flight. The current instrument suite is specifically designed for PACE-PAX, with contributions from NASA, NOAA, and NPS. We sample aerosols by bringing air into the cabin via an inlet referred to on the Twin Otter as the “snorkel,” which looks a little like a large black football on a stick that protrudes just past the nose of the aircraft. We then route the air through a series of tubes towards each of the nine instruments in the cabin. Measurements are made in real-time, so the flight scientist on the plane can monitor each instrument during flight and use the measurements to inform decisions about the location and altitude of the aircraft. It takes us approximately 30 minutes to prepare for the flight and make any necessary last-minute trips to the bathroom (no lavatory is available on the aircraft during the three- to four-hour flight!)


11:59 Local Time: Twin Otter Takeoff
With an on-time departure from Marina, we did a counterclockwise circuit: 1) through the Central Valley of California and spiraling over a ground station at California State University Stanislaus; 2) spiraling over a site at the Sacramento-San Joaquin River delta; 3) spiraling over the San Pablo Bay just north of San Francisco; 4) flying at altitudes of 1,000 to 2,500 feet over the San Francisco Bay; and finally 5) completing a low approach at Moffett Field before returning to base. Just before landing, the Twin Otter did two more low-level passes over the runaway at Marina Municipal Airport at an altitude of 70 feet to confirm consistency with the ground-based tower measurements and to evaluate the transmission of the snorkel inlet.
We observed generally clean conditions throughout the flight, since most of the wildfire smoke emissions in the region were being transported to the east and outside our flight domain. Those conditions will be perfect, though, for testing satellite retrieval algorithms under the most difficult conditions when there is low aerosol ‘signal’ in the atmosphere. As a bonus, we got to view the Golden Gate Bridge and San Francisco skyline from a vantage point not often possible in airspace that is so congested with commercial traffic.


15:38 Local Time: Twin Otter Landing
After accomplishing our objectives in flight, our day concludes by downloading all of the data collected on that flight and summarizing the science highlights with project management during a post-flight briefing. These meetings are used to track mission progress and to communicate objectives and flight plans for the following day. A typical airborne mission will have two to six flights per week with a flight window of up to six weeks. During today’s meeting, we were briefed on a plan to fly to Southern California to test the other end of the aerosol ‘signal’ spectrum by sampling wildfire smoke from the Bridge, Line, and Airport fires. We were back at the hotel in plenty of time to enjoy a Buffalo Bills blowout win over their division-rival Miami Dolphins, and back on the aircraft the following day.
Our next steps are to process the data and share it with the rest of the science team. This helps other instrument teams analyze their own data and the project leadership evaluate how successfully we completed our objectives for the flight. Once we complete our calibrations during and after the mission, we can perform one last set of quality checks, and then the data will be shared with the public as well.

Hello from sunny Santa Barbara, California, where the ship operations for the PACE-PAX campaign are underway!
The PACE satellite went into orbit in February 2024. Its mission is to help us better understand how the ocean and atmosphere exchange carbon dioxide, as well as how aerosols can fuel phytoplankton blooms and help us track harmful algal blooms around the planet.
PACE-PAX stands for Plankton, Aerosol, Cloud, ocean Ecosystem – Postlaunch Airborne eXperiment (see why we made it shorter?) We are using two airplanes and three ships, among other free-sailing instruments, to gather data that will tell us how well our shiny new satellite, PACE, is doing. We compare our planet-side data with the space-side data so we can make sure we are providing the very best information about the health of the world’s oceans.

Our planes are the ER-2, which is a super high-flying plane that hangs out right near the edge of space, and the Twin Otter, which holds a variety of instruments that are vital to the aerosols part of the mission.

Our ships are the R/V Shearwater, the R/V Blissfully, and the small fleet of R/V Fish boats. The R/V Shearwater is the main ship for this campaign. She holds a science team from multiple organizations and a wide variety of instruments. These include some that stare at the Sun, some that go in the water, and some that stay on deck.
The R/V Blissfully is a sailboat located in Long Beach, California, that is taking an important subset of measurements to complement the Shearwater. She has a crew of just two people, so they are extra busy!
Finally, the R/V Fish are our rapid response vessels. They can move around much faster than the other two and can get to specific locations quickly to take critical measurements.

My job is to collect water samples and filter or store them for analysis back in the lab, all the way back in Maryland. The samples I collect will be analyzed with at least five different instruments, which cannot be brought out to sea. There’s not enough space, and some of the instruments have dangerous elements that are not worth the risk of using while on a boat. There is also the issue of space. You can only bring so much to sea, so we take and preserve samples that can wait for analysis.

PACE-PAX is unique in that our cruises are day cruises. Usually, we get on a boat and don’t get off until the campaign is over. That can be days to weeks to even months living on a ship! This time we get to go back to a hotel in the evenings, which feels very odd in comparison. It can be hard to get your sea legs when you aren’t given time to get used to the motion. I have been relying on medication, ginger, and very salty snacks to get me used to the motion in the ocean.

I hope you enjoy learning more about this campaign in future Notes!
]]>
May 25, 2024
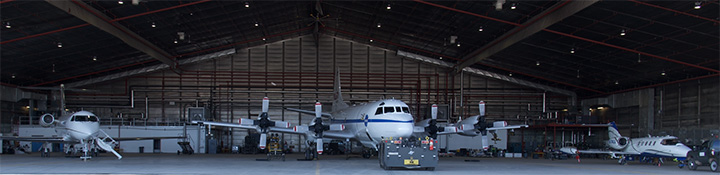
Some 25 of us were up before 6 a.m. to head out on the bus from the hotel to Burlington International Airport to catch the C-130 aircraft, a military transport plane repurposed for NASA fieldwork, to begin our 7-hour flight to Pituffik.
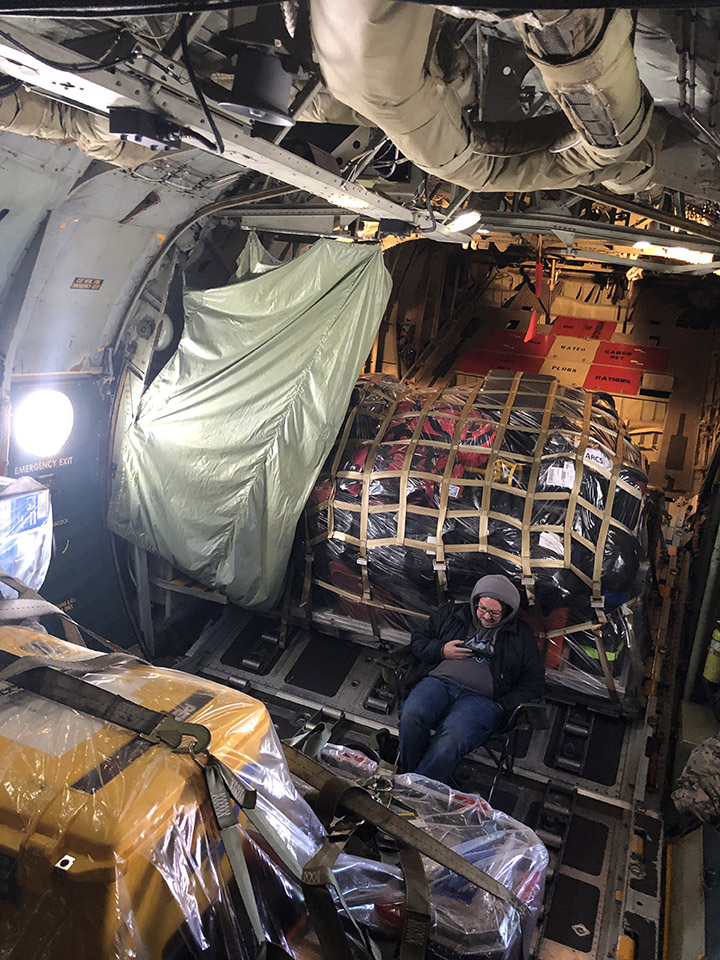
Several mountains of baggage, including scientific instruments and personal luggage, separate us from the less-well-heated economy cabin, which was probably reserved for graduate students, though we are far too collegial a group to check seat assignments. As we head north and east, the landscape out the window is vast, entirely gray-scale, and unforgiving: sea ice with streaks and patches of open water as far as one can see in every direction.
About halfway through the flight, we cross the Arctic Circle. Here the scene is often reduced to pure gray, and one cannot tell what is sea ice, snow, or cloud. This is the challenge we have long faced when attempting to interpret our remote sensing imagery; now, as an early gift of the expedition, I experience it directly.

May 26, 2024
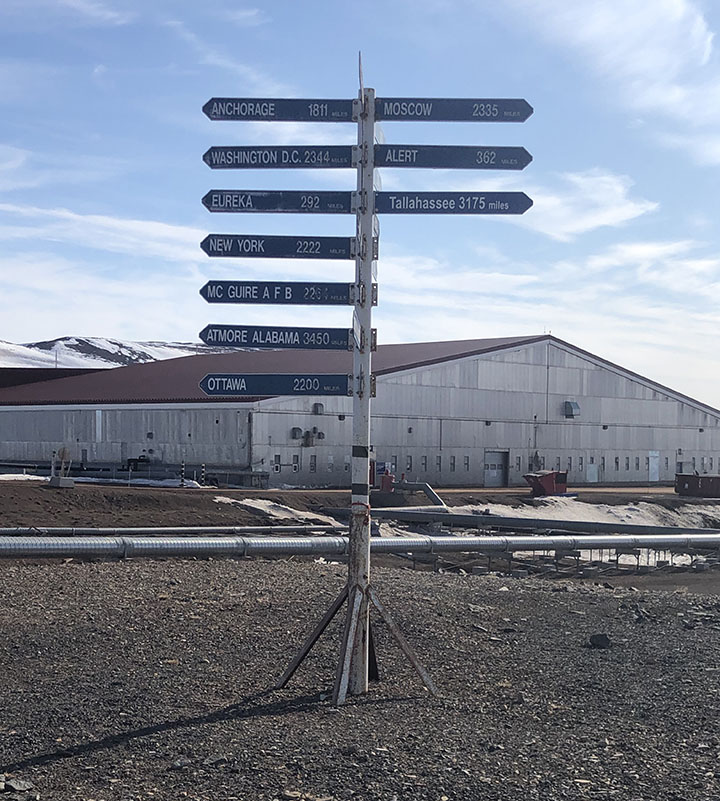
The site is halfway between Washington and Moscow. Most or all of the buildings were prefabricated, brought here by ship in the summer, and mounted on stilts due to the permafrost. Some rough grasses are the only apparent vegetation.
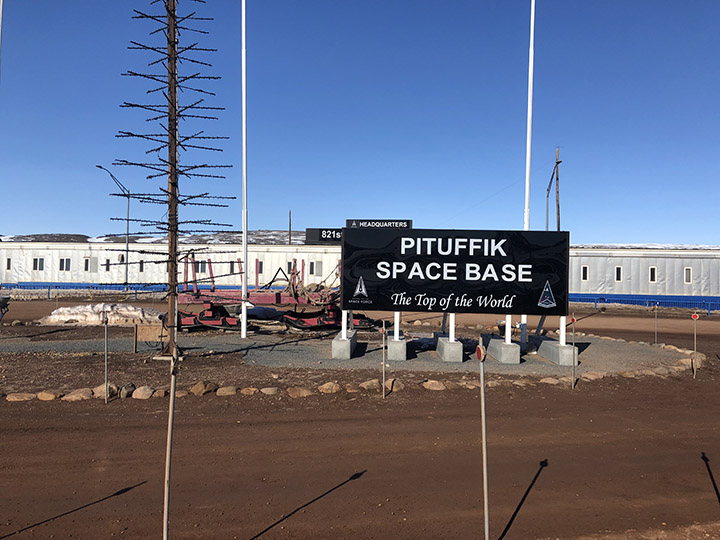
In some ways, the base is well appointed. There is a sports center with an abundance of every conceivable exercise machine, also a tanning machine and a perpetual pool, a huge gym, and a yoga room. There is a recreation center with a movie theater, a lounge area with free apples, tea, and coffee, a game room that is more like an arcade with multiple video machines, and a craft center that has sewing machines (including a state-of-the-art Serger), rock cutting and polishing machines, computer graphics, and printers.
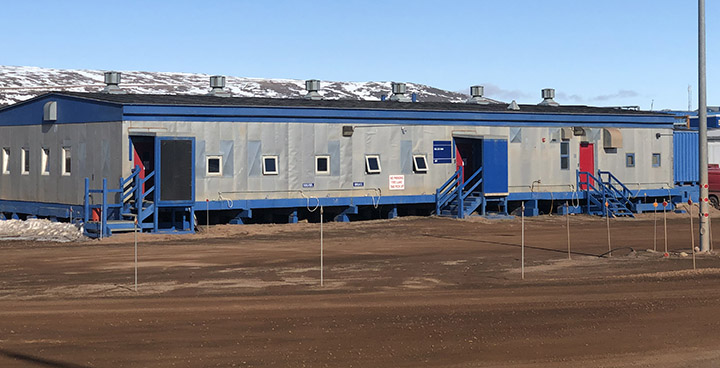
This is a remote place. The site is protected by a thousand kilometers of ice in nearly all directions, and the only ways to get here are by air or by boat for a couple of months of the year, when the sea is not frozen. With full daylight all day and “night,” the times-of-day are marked only by artificial clocks; the natural ones are essentially absent.
May 27, 2024
This was mostly a flight-planning day, getting ready for the first science flight of the campaign. It turned cold, windy, and snow fell today. This was more like what I expected but didn’t experience during the first two days. But now it is sunny again, around 6 p.m., and near-freezing, so there is still standing water on the roadways, and we are past the season when it is safe to walk on the ice-bound bay. The severe environment calls for some specific adaptations.
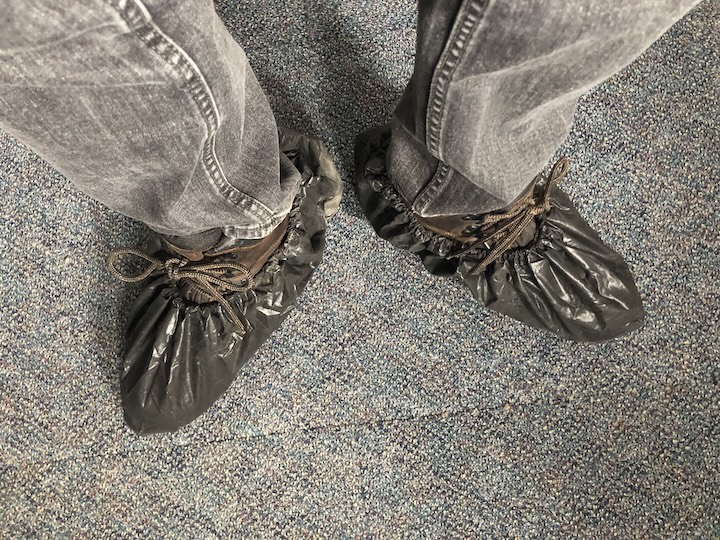
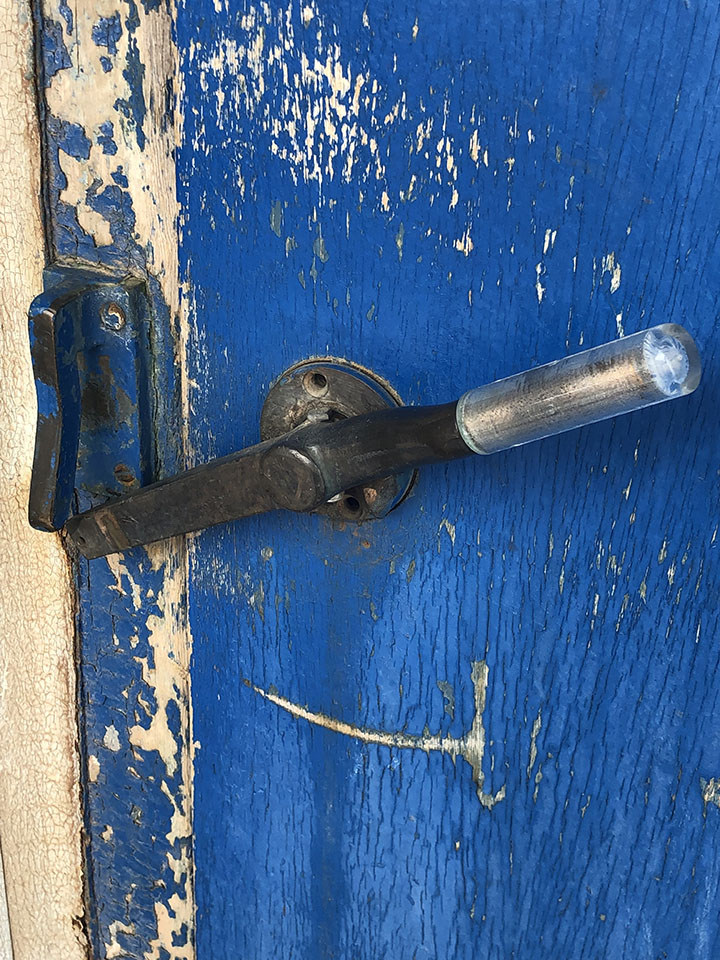
For example, the outer doors have latches that seal upward, so a bear pushing down on the handle will be unable to open the door. The walkways are made of open steel grids, so snow and mud will drip through. Boots are to be brushed before entering buildings, and plastic boot covers are provided in an effort to limit the amount of dirt that is tracked in.
I took a late-night walk. It’s daylight anyway, though overcast, windy, cold, and flurrying. Pretty much what I expected here.
The power went out twice today. Everything goes down, including the internet. I’m trying to keep everything charged, in case it happens again. Today’s weather represents “Condition Alpha” for storm warnings. That means just be on alert, in case things change. Condition Bravo means you cannot go outdoors without a buddy, or drive alone without a radio. Condition Charlie means you can’t walk out at all; there is a base taxi for urgent movement. Condition Delta: shelter in place.
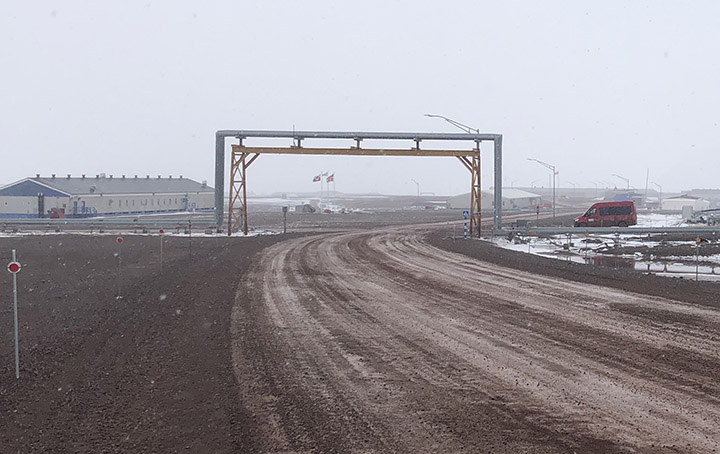
The pipes are all above-ground because of the freeze-thaw cycle that would destroy the pipes. I guess they must be heated and insulated. They cross the road by going overhead.
Car and truck engines must be heated to avoid freezing and cracking. So, many of the buildings have power cords hanging out in front to run electric engine-block heaters. I didn’t take the last picture quite at midnight, but the scene doesn’t change much during the night.
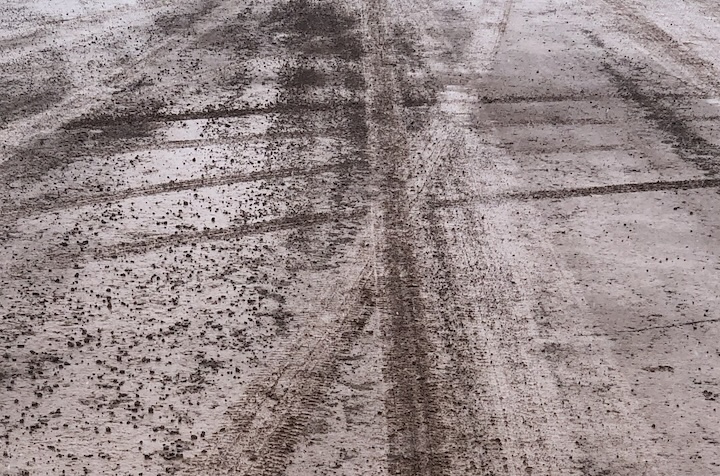
I think I mentioned that it is mud season here. This is no joke. The place has a very industrial feel, and the only place to walk is on the mud roads. I’ve heard it will get worse as the mud deepens, and mosquitoes come out. Something to look forward to…
May 28, 2024
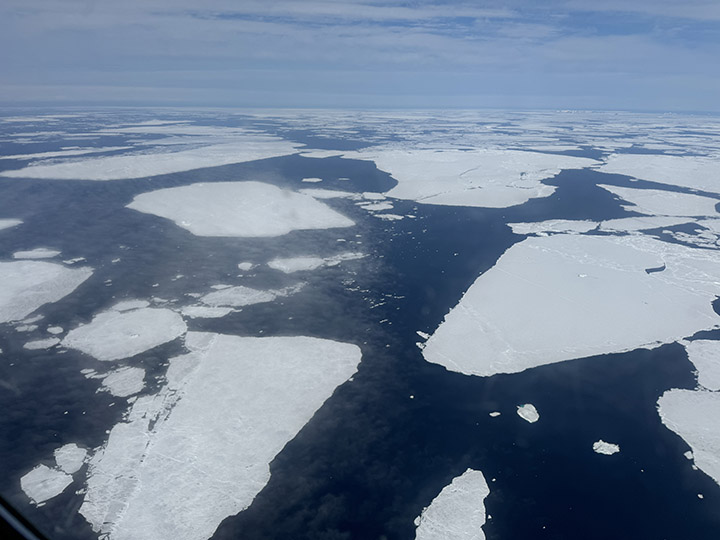
We had our first flight with the P3 today, and it was far better than I had expected. There was a rare case of cloud-free atmosphere over sea ice in one area north of Greenland where some buoys had been deployed, which allowed for both surface ice and aerosol characterization. Also, a nearly 3-hour run at ~500 feet captured aerosol properties over open water along the northern part of Baffin Bay. Among our objectives are learning the sources and properties of aerosols in the Arctic, their evolution as they age, and their impact on clouds. Others are especially interested in the properties of sea ice as it melts. So, this gives us a start on those objectives.
May 29, 2024
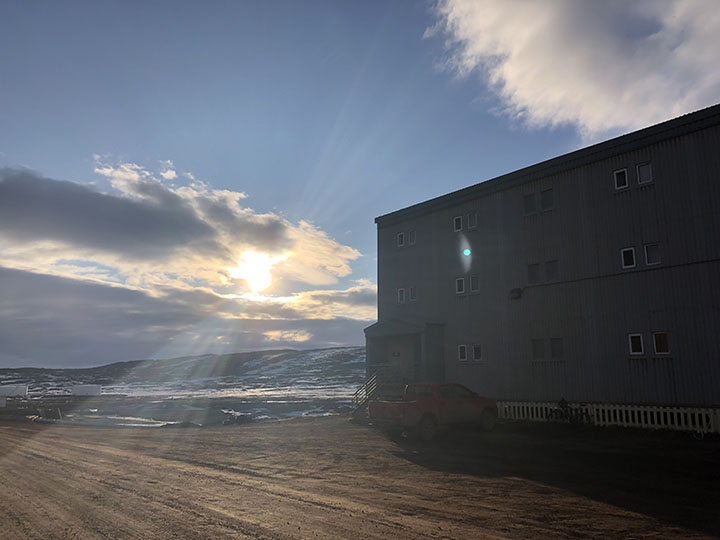
The wind is a force of nature. Today it has been blowing at something like 40 miles per hour, with gusts considerably higher. It literally takes your breath away—and this is just Condition Alpha.
Gusts create the sensation of blowing you away. All this under a relatively clear sky, bright sun, just a few clouds. It is somewhat other-worldly to one who has lived a life at lower latitudes. The temperature is only a few degrees below freezing, but the weather today gives new meaning to the term “wind chill.”
June 1, 2024
Today was an official day off, and in particular, a mental health day for the forecasters. Several of the military folks on the base arranged to take a group of us on a hike over the Greenland Ice Cap. There were 15 of us in five trucks. The trip involved a fair amount of driving on gravel roads in trucks—about half the time driving, half hiking – 5 hours total. The hike itself was about 5 or 6 miles, and we walked around and then on the glacier, though we never did find the Starbucks.

In addition to the stark beauty of the rock fields and ice, the sky is unlike anything we normally see at lower latitudes. The surface is cold, and the atmosphere is no colder (and sometimes is even warmer) than the surface, i.e., it is stably stratified—the “warm” air is already up, so there is not a lot of warm air rising and mixing that typically happens when the surface is heated directly by the Sun.

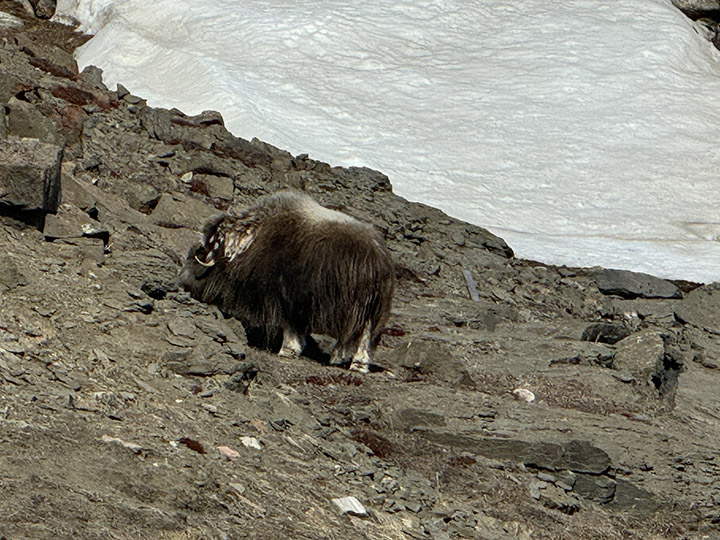
The glaciers have brought an enormous diversity of stones that litter the ground, and every piece of wood here was carried in from somewhere else. There are little clumps of vegetation, just enough to satisfy the appetites of musk oxen.
So far, I’ve seen Arctic fox (no pictures—they disappeared too quickly), musk ox in the distance, Arctic hare, and snow goose. No polar bears—and no complaints about that.
June 7, 2024
This evening I took a long walk out to the ice-bound pier… AND I SAW AN OTTER!!!

June 4, 2024
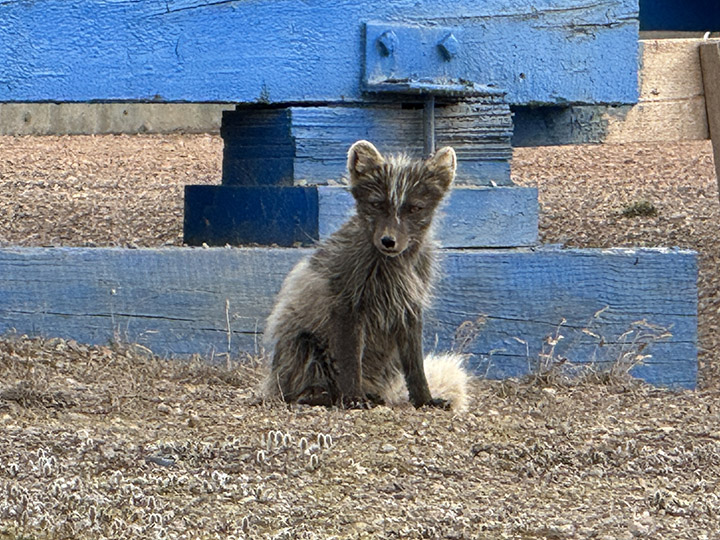
The Arctic foxes are molting. They were very cute when their coats were all white. Now they are losing their winter coats and turning brown. I did see a couple of full white coats, but was too slow to get a photo.
June 8, 2024
The project rented a van, and ten of us went off to climb the Dundas, that imposing rock feature not far from the base, though to get there without walking on thin ice (here the term is not merely a metaphor), one has to drive about 30 minutes over rocky and sometimes quite steep roads around the frozen bay.

The angle of repose is the angle a pile of dry sand (or salt) will make if you dump a bucket of it on the ground. It is generally steep (depends in part on the grain size and shape of the sand particles). Dundas is about 725 feet high; it appears to be the remnant of a glacial moraine—rock pushed here by an advancing ice sheet at least that high, that remained after the ice melted away. It is loose sand and rock, mostly gravel and cobble-sized. The climb up was, frankly, arduous, as there are not a lot of footholds.

The first part was steep enough that going on all fours was necessary in places, and the sand and small rocks would slip easily down the slope as one persevered upward. The final part was up a sheer rock wall that was graced, mercifully, with a sturdy rope. My pictures are lacking for the entire traverse, as all my effort went into the climb itself. I did stop part way up the rock wall to check my life insurance policy.

The view from the top was spectacular, but truthfully, there are so many great vistas in this rugged place that the main reward was accomplishing the ascent itself.
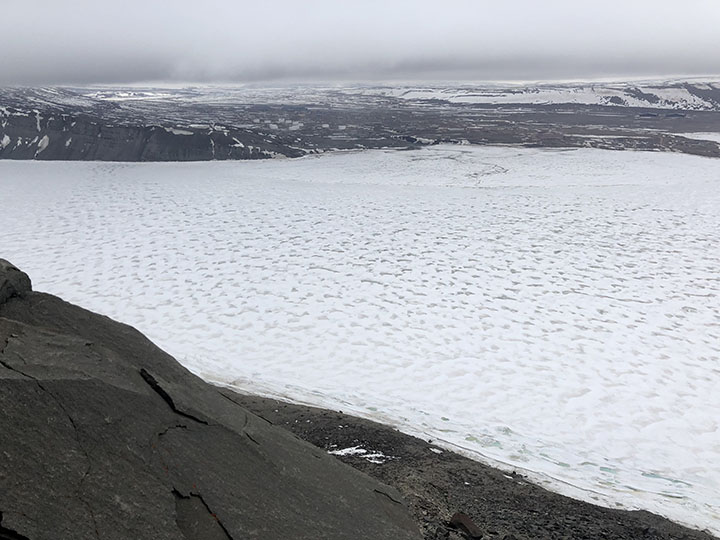
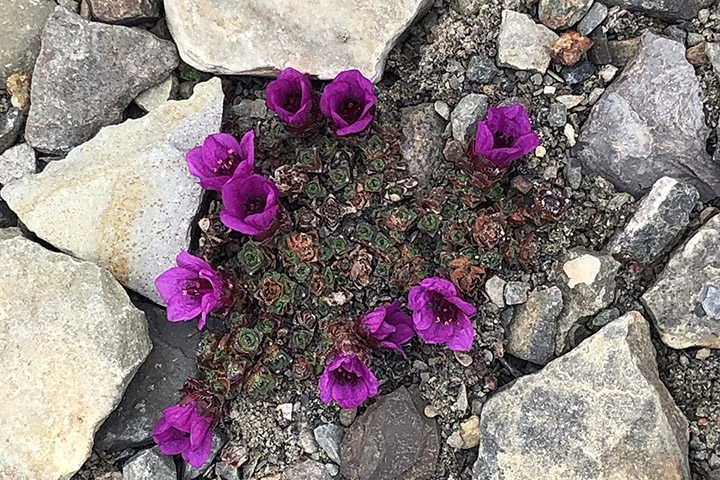
The way down was similarly fraught, except that below the rock wall, I had pretty much no choice but to slide down bit by bit—the loose surface material would give way at every step. So, on my back, lift up my rear, slide a few feet using my boots to stop, and repeat. There was some interesting vegetation on the slope—tiny plants and lichen, which I did photograph. I’m told that some of these plants can be hundreds of years old.
In the distance, we saw some dark spots that the binoculars suggested were seals. (Oh, yes—someone here said that my otter from last night was actually a ring seal; not sure that is authoritative, but…).
June 9, 2024
I agreed to join this afternoon’s walk up the edge of the Greenland Ice Sheet.
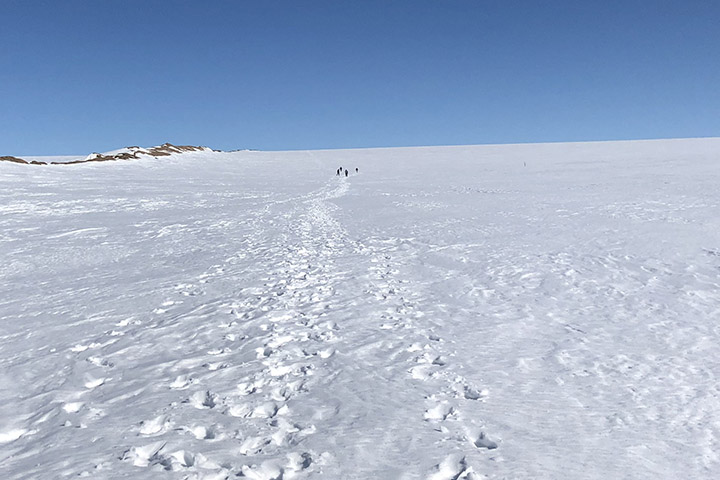
The slope is moderate by Dundas standards, and the path is completely snow-covered. The walk up is of course uphill, and a steady wind of 30–40 mph (the katabatic wind), with significantly higher gusts, blows off the ice. This guaranteed that however far we got up the ice sheet, we would certainly be able to make it down, either on foot or airborne.

There were pools of water within ice basins at the base. They look a beautiful shade of blue. We saw this in Alaska as well. I think it must be that ice either absorbs all the longer wavelengths, or it preferentially scatters blue, or both. The optics here are stunning, at least to me. Probably because they are unfamiliar.
One way painters provide a sense of distance in a painting is with “atmospherics,” that is, they increasingly blur the edges of more distant objects to account for light scattering by atmospheric gas and aerosols. Mountain climbers experience the opposite, in the thinner atmosphere, remote objects are sharper than they would in everyday experience, so more distant objects appear closer than they actually are. This is true here in Greenland as well, though we are not at a very high elevation along the coast. I expect the phenomenon in this case is due to a very clean atmosphere.
June 11, 2024
Today I got to fly on the P-3. Every satellite scientist should be required to take at least one such flight to see what the Earth is really like. We flew across northern Greenland and over sea ice. In the two weeks since the campaign deployment began, the depth of the sea ice, and the snow upon it, both decreased at those buoys (where it was measured), and, of course, most everywhere else as well.
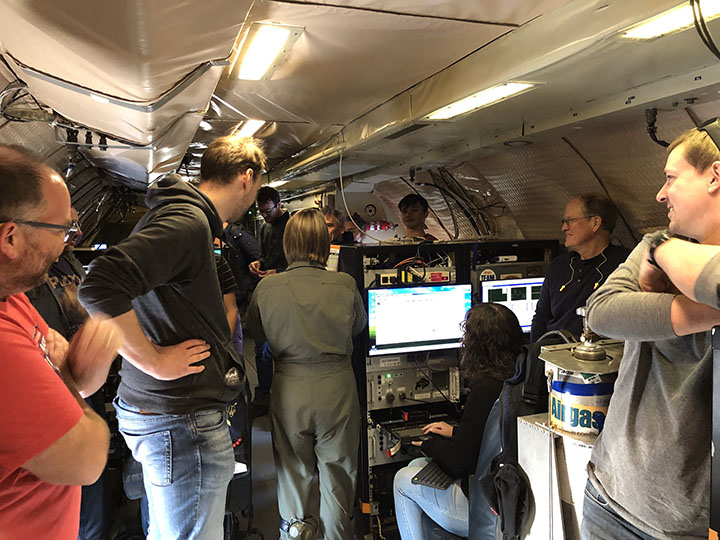
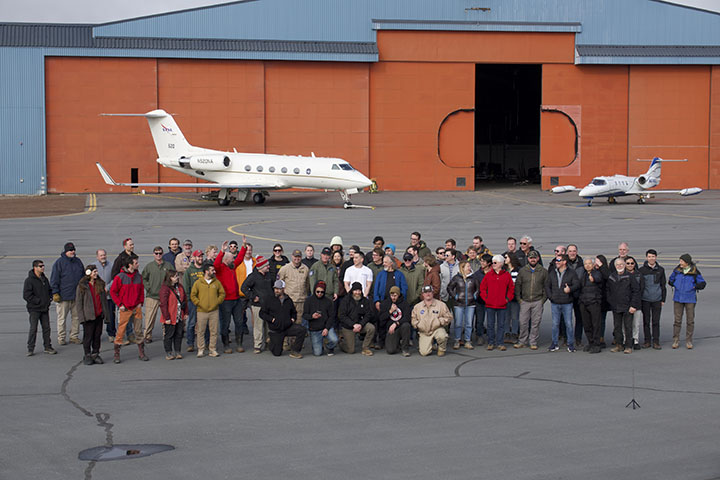
A field campaign is a layered operation. Aircraft flight scientists build, run, and maintain the twenty or so instruments that measure particle composition, gas concentration, cloud properties, surface reflectivity, and upwelling and downwelling energy. They are awake by 4 a.m. to prepare their instruments for flight, worry about power supplies and calibration, then sit on the plane for six or seven hours, noting what they see from their measurements and out the window.

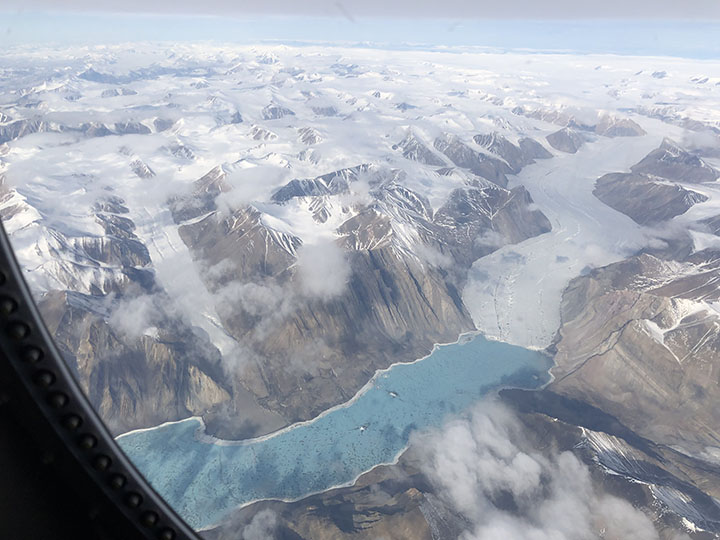
The number of leads (i.e., openings in the ice) has increased in places. We flew at high elevation to survey the area, measure the overall surface topography and reflectance, and sample aerosol layers aloft, then descended to 300 feet above the ice to capture aerosols emanating from the surface. The photos tell an accessible part of the story. The rest must be teased out of the data in the coming months and years. But my ride is over for now—there is an aerosol forecast due tomorrow.
June 12, 2024
It was flurrying this evening, and my walk carried me down toward the pier. But you might be pleased to know, I did not go all the way; several seals have now been seen on the ice at the pier. My otter or seal in the water was the first anyone saw, and although they say it is relatively rare for bears to go near the base, seals are their primary food. I figured, after a long winter hibernation, a bear might not count me as even a light snack, but in consideration that I had already booked my flight home, I turned around before getting very near the water’s edge.
June 14, 2024
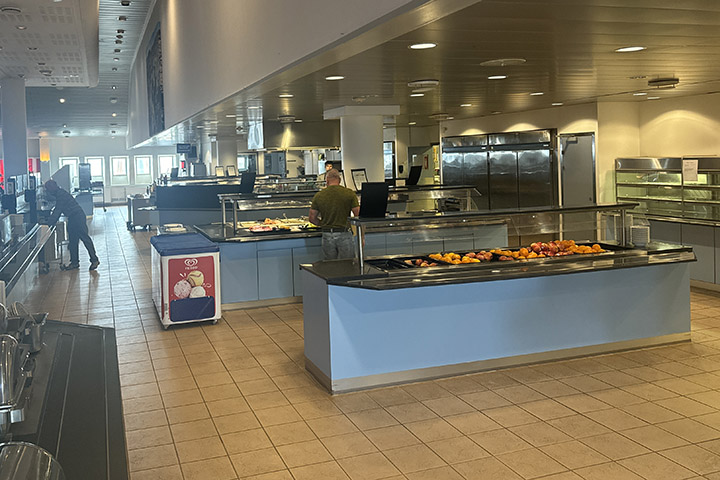
I should say that the food here is okay. Better than I expected. Of course, in such circumstances, it pays to begin with low expectations: hardtack, pemmican, and beef jerky. The cafeteria serves a lot of beef and pork, but there is also chicken, a reasonable salad bar, excellent, fresh bread (the highlight in my opinion), always two of THE three kinds of fruit (apples, oranges, and bananas—so yes, they mix apples and oranges), and of course, Danish, at least in the morning.
In the evening I took a walk, as usual, and ended up in one of the dozens of prefab buildings on the base, with the suggestive label “Heritage Hall.” The door was not locked, and the lights turned on as you entered each room. The place is a sort of museum, a repository for things discarded from the 1950s and 60s.
They have a computer punch-card machine, a vacuum-tube TV set, and a radar scope you will recognize from science-fiction movies. Also some notebooks with photos of the army’s Camp Tuto (now abandoned—only remnants of the airfield remain) and the presumptive city “Camp Century” they built into the ice in the 1950s. The walls flowed at glacial speed but ultimately collapsed.
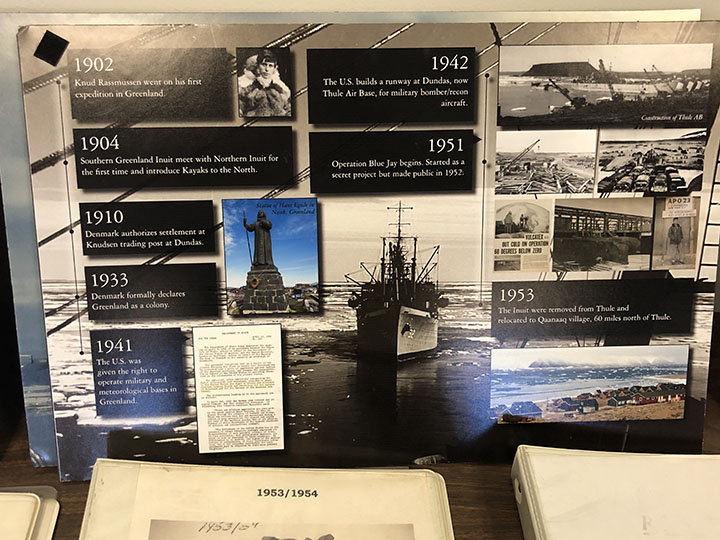
Thule base was established in 1951, succeeding three waves of Inuit who inhabited the area, apparently beginning 4,500 years ago. The most recent came around 900 CE, met the Norse about 100 years later, and were moved to a new village 60 miles to the north in 1953. There is even a Life Magazine cover showing ships delivering material to the base in September 1952.

Ralph Kahn, an emeritus research scientist at NASA’s Goddard Space Flight Center now at the Laboratory for Atmospheric and Space Physics at the University of Colorado Boulder, spent three weeks at Pituffik Space Base in northern Greenland in the summer of 2024. He was one of dozens of scientists who participated in ARCSIX (Arctic Radiation-Cloud Aerosol-Surface Interaction Experiment), a NASA-sponsored field campaign that made detailed observations of clouds and atmospheric particles to better understand the processes that affect the seasonal melting of Arctic sea ice. These excerpts from his emails home to family provide a glimpse of what life was like on one of the world’s most northern scientific outposts in the world. Photos were taken by Kahn or Gary Banzinger, a NASA videographer who also participated in the campaign. Kahn, an atmospheric scientist, worked with colleagues to provide daily aerosol forecasts that were used to help plan flights.
]]>Hello from the Goddard Instrument Field Team! Earlier this summer, we visited Katmai National Park as guest researchers. These are some of our photos and notes from the field.
In June 1912, the largest volcanic eruption of the 20th century blanketed glaciers with ash in what’s now known as the Valley of Ten Thousand Smokes. Our 2024 expedition took us deep into the valley, seeking answers about icy volcanic landscapes on Earth, Mars, and beyond. The data and samples we gathered here will help us understand how these buried glaciers and the volcanic deposits on top are evolving over time.
Into the Valley of Ten Thousand Smokes
How do you pack for nine days of hiking and camping in bear territory? Carefully! We secured food and scented items in bear-proof canisters, mapped out tent placements to fit within the perimeter of a portable bear fence, and worked closely with Katmai National Park to minimize our impact while in the backcountry.

The journey from Anchorage to our base camp near Knife Creek included flights on tiny aircraft, “Bear School,” a school bus equipped to ford rivers, and a sixteen-mile hike complete with more water crossings and high winds. On day two in the field, a helicopter carrying large items, such as heavy science gear and a group water filter, reached the valley. In case weather prevented the airdrop, we were ready to complete some key tasks using just what we carried on our backs, but we were glad to see the equipment arrive.
Studying Buried Glaciers
In the field, we worked on and around glaciers covered in huge piles of ashy debris. Some team members used ground penetrating radar (GPR) to scan subsurface structures from above. Together with drill coring, hand-dug pits, and a soil moisture probe, GPR gives us insight into what’s going on underground.
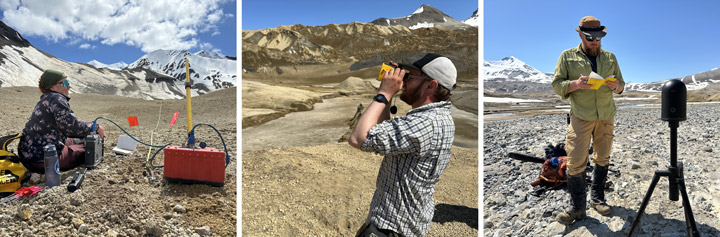
Other scientists studied the insulated glaciers from a different perspective: edge-on. They used laser ranging techniques to find out how the face of an ash-coated ice cliff morphed and receded throughout our week of work. We’ll compare these on-the-ground measurements with orbital images of the same area captured over longer periods of time. Combining field data and satellite imagery helps us better understand how the glaciers are evolving.
Planetary Science, Close to Home
We’re a team of planetary scientists, so our science questions on this trip applied to both Earth and other worlds. How does a blanket of ash affect the way glaciers are preserved? What chemical and mineral signatures can we find in the debris from a huge volcano like this one, and how are those signatures changing? What can the patterns we see today tell us about how microbial life has interacted with rock in this extreme environment?
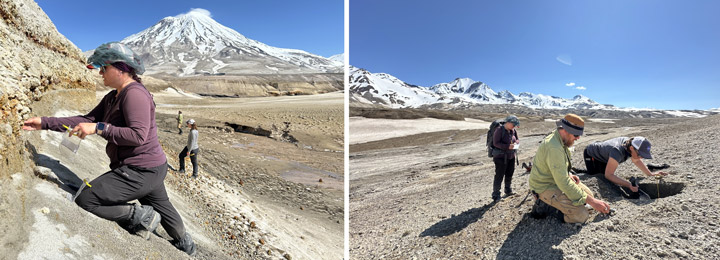

Many planets and moons have volcanic pasts, and we’re still trying to learn exactly what kinds of volcanism have shaped their surfaces. Ice is common throughout our solar system, too. Ground-truth data from field sites like this one can help us interpret evidence found on faraway worlds, where it’s harder to collect and examine samples.
Learn More
Into the Field with NASA: Valley of Ten Thousand Smokes
Comparing Earth and Other Worlds: NASA Planetary Analogs
]]>A combined team from the University of Helsinki (Environmental Change Research Unit), the Finnish Meteorological Institute (Atmospheric Composition Unit), and the Vrije Universiteit Amsterdam (Climate & Ecosystems Change) was on its way again to gather groundbreaking data on carbon and aerosol emissions from increasing fires in the northern high latitudes. Our journey began in boreal Quebec and now continues to Arctic Greenland.
Climate change is warming the Arctic with partly unexpected consequences. In recent years, unprecedented wildfires have raged through Arctic permafrost terrain burning in 2019 and 2020 alone, an area equal to half of what burned in the previous 40 years. In Greenland, a land known for its icy expanse, fires are rare. However, in July and August 2019, the second-largest wildfire recorded on the island occurred at the Kangerluarsuk Tulleq, northeast of Sisimiut. To our knowledge, fire effects in Greenland have never been studied—until now, as we begin our investigation.

To estimate the carbon burned and greenhouse gases and aerosols released during tundra fires, we assess post-fire ecosystem effects. We measure the dominant ecosystem types within the fire scar and compare them with unburned areas. We evaluate fire severity, and we conduct various aboveground and belowground measurements to calculate and date carbon stores.
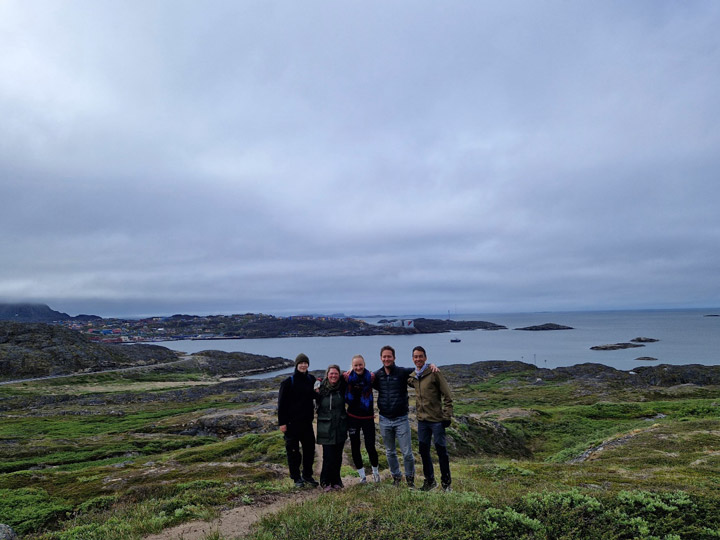
Our campaign aimed to efficiently use 29 hours at the destination by collecting samples from all major ecosystems within the fire scar. We arrived by boat (hiking from Sisimiut is also possible but would take 2 days) and spent the day sampling. We camped near the shore, with some of us taking a daring dip in the sea. We continued sampling the next day before returning to Sisimiut in the evening. The study area exemplified the Arctic steppe ecoregion, featuring fragmented ecosystems ranging from barren rocky slopes and drier fields dominated by moss and lichen to moderately wet peatlands. We successfully collected a diverse set of samples from various ecosystems for detailed lab experiments and analysis to be performed back in Finland.

As we were preparing to head home from Greenland, we encountered unexpected foggy weather, which led to flight cancellations for several days. This gave us a well-appreciated few extra days of adventure. Three of us packed our hiking gear and embarked on an overnight hike. The summit of the two mountains we climbed was unforgettable. A key lesson for traveling in Greenland: keep your schedule flexible—it’s worth it!
Overall, the field campaign was a unique, once-in-a-lifetime experience. But that’s not all—can you guess where the fiery journey of Granqvist and Diaz will take them next? Stay tuned!

The Greenland fire expedition was organized within the Research Council of Finland Academy Research Fellow project “Fire in the Arctic,” led by Meri Ruppel, and the Kone Foundation project FLARE. The fieldwork was also part of FireIce (Fire in the land of ice: climatic drivers & feedbacks), a Consolidator project funded by the European Research Council. FireIce is affiliated with NASA’s Arctic-Boreal Vulnerability Experiment (ABoVE). This blog post was written by Sonja Granqvist, a Ph.D. student at the University of Helsinki, studying Arctic-boreal fires in collaboration with the Climate & Ecosystems Change research group from the Vrije Universiteit Amsterdam.
]]>This blog post is the first in a series to come. Our team, the Climate & Ecosystems Change research group from the Vrije Universiteit Amsterdam, is working in collaboration with the Environmental Change Research Unit from the University of Helsinki for a summer with lots of fire field work, science, and adventure. On this journey, our first stop was the Quebec province in Canada. I’m writing this post after our last day of fieldwork here.
The 2023 wildfire season was the largest on record in Canada, with more than double the burned area as the second largest year. In Quebec, an estimated 4.5 million hectares were burned, an area slightly larger than the size of the Netherlands. This record-breaking fire season in Quebec was due to extreme warm and dry conditions. The dense smoke plumes from the 2023 Quebec blazes shocked the world when the smoke reached several cities on the US East Coast, including New York City.
Fellow scientists have been digging deep to understand and explain the phenomena involved in this Quebec fire season. However, as far as we know, estimates of carbon combustion, or the amount of carbon per area burned that is released during a fire, have never been made in Quebec. That’s why we are on it! In loco, since field measurements are a prime way to quantify carbon emissions from fires.

We assess post-fire ecosystem effects to calculate carbon pools below and above ground. In other words, this is the carbon stored in the soil and vegetation. After collecting soil samples and inventorying the vegetation, we can compare burned and unburned (control) locations to estimate how much of this carbon was emitted to the atmosphere due to fire. We do this comparison based on what is called the adventitious root method. On black spruce trees, adventitious roots grow above the initial root collar into the upper soil layers and provide a reference for the pre-fire soil height, as they remain clearly visible many years after fire.

During our expedition, we covered more than 4,000 kilometers on the road. We started by traveling north from Montreal along the James Bay Road and began our sampling at two fires near the locality of Radisson, where the remote Trans-Taiga road was our daily route. We then headed to Waskaganish, on the southeast shore of James Bay, where we sampled another fire. Finally, we ended our campaign at a large fire in the commercial forest near the town of Lebel-sur-Quévillon. All these trips allowed us to make a scientifically interesting transect from North to South in the Quebec province. We also got to know some incredible places, and we are grateful to the people living there who welcomed us.
We were able to observe two different types of intermixed ecosystems in the fires we visited. We found forests dominated by black spruce in peaty lowlands. In drier and often rocky uplands, Jack pine trees dominated. I’m curious to see how these differences will be reflected in practice when we analyze the carbon combustion in these systems.

Our team in the campaign was Lucas Diaz, Max van Gerrevink, Thomas Janssen, Yuquan Qu, and Sander Veraverbeke from VU Amsterdam, and Sonja Granqvist from the University of Helsinki. The success of this expedition is also thanks to our collaborators here in Quebec who helped us during our preparation: Dominique Arseneault (Université du Québec à Rimouski), Jonathan Boucher and Yan Boulanger (Canadian Forest Service), and Fabio Gennaretti (Université du Québec en Abitibi-Témiscamingue).
This fieldwork is part of my PhD project, so I was responsible for leading and organizing the entire expedition. As hard as it was, the whole process was also a lot of fun. Several times during the campaign, I felt like I was on a holiday road trip with a group of friends. In the end, that’s not entirely wrong. This kind of experience brings us closer to people. It strengthens existing bonds and creates new ones. This great adventure gave me moments that I will remember forever.
Time passes quickly here in the boreal forest. Soon, it will be time to pack our bags and embark on the next stage of this fiery journey. Curious about the destination? Stay tuned!

The Quebec fires expedition is part of FireIce (Fire in the land of ice: climatic drivers & feedbacks). FireIce is a Consolidator project funded by the European Research Council. FireIce is affiliated with NASA’s Arctic-Boreal Vulnerability Experiment (ABoVE). This blog post was written by Lucas Ribeiro Diaz, a Ph.D. student at Vrije Universiteit Amsterdam, studying Arctic-boreal fires by combining field and remote sensing approaches.
]]>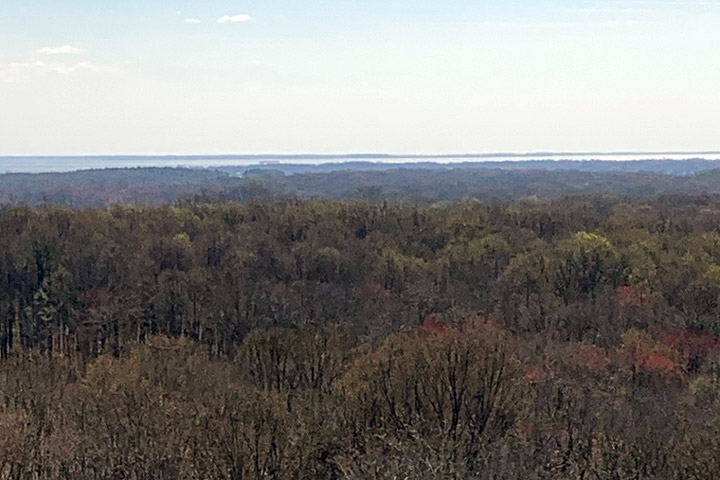
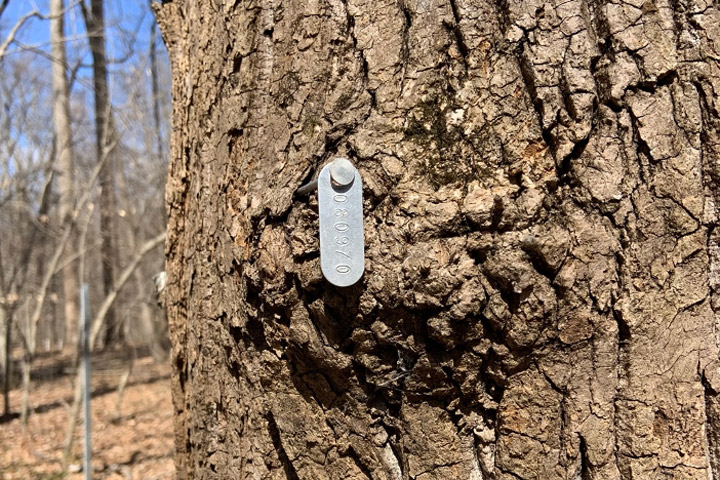
On a blustery March morning, Petya Campbell stood atop a 204-foot-tall tower and looked across the waving canopy of the leafless deciduous forest at the Smithsonian Environmental Research Center in Edgewater, Maryland. This forest is predominately tulip poplar (Liriodendron tulipifera), and the tower extends over trees that are over 120 feet tall.
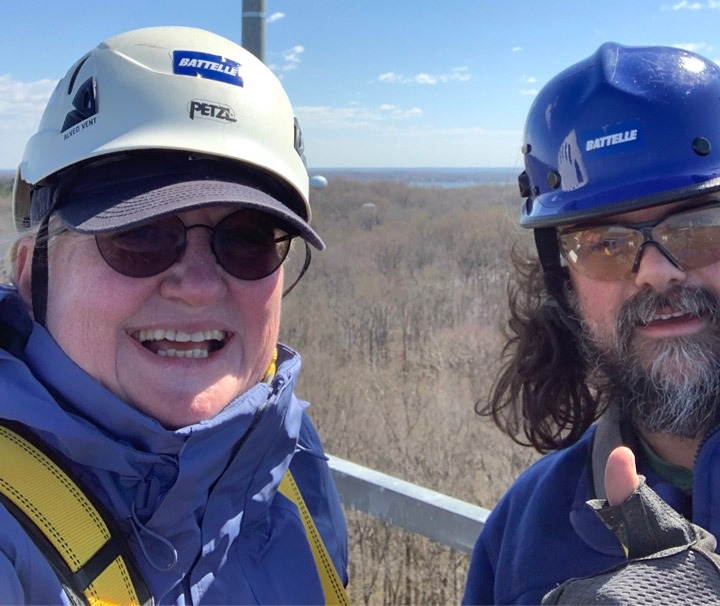
Petya, from the University of Maryland Baltimore County and NASA Goddard Space Flight Center, is working with Greg Cain, a master technician from the Battelle-managed National Ecology Observatory Network (NEON)—the U.S. National Science Foundation-funded program that runs the tower at the Smithsonian site (SERC). Petya and Greg were on the tower that day to install a new type of instrument, an automated spectrometer called a NoX (Near Infrared Box). The NoX measures the light reflectance off the forest canopy in hundreds of narrow spectral bands through the visible wavelengths we can see and into the near-infrared bands beyond our vision. The instrument will make these measurements every few minutes throughout the entire growing season.
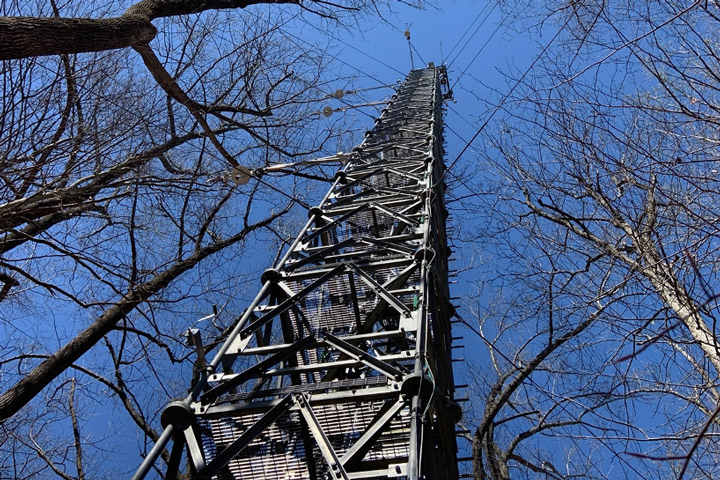
In addition, NEON runs instruments on this tower that take measurements of the movement of carbon dioxide (CO2) into and out of the forest. CO2 is absorbed from the atmosphere into the trees through photosynthesis, so measuring the amount of CO2 taken up by the plants is a measure of forest productivity. These CO2 flux measurements are collected continuously and reported every half hour.
The time series of spectral reflectance measured by the NoX can provide information about leaf characteristics. For instance, it can tell scientists about the amount of green biomass and chlorophyll in the leaves, which determines the potential productivity of the forest; the amount of other leaf pigments that are used to protect the leaves from damage, which indicate when the trees are under stress; and the amount of water in the leaves, which can be used to detect drought stress.
Researchers will use data from the NoX to gain insight into the functioning of this deciduous forest as it responds to environmental conditions such as hot or cold spells, droughts or rainy periods, and sunny or cloudy days. They will observe seasonal changes from the time the leaves emerge in the spring, through the green of the summer, the changing colors of the autumn, and finally the loss of the leaves at the end of the growing season. Others can watch the forest change through the seasons using the phenocam, a web camera mounted on the tower that regularly takes photographs to monitor the changes in the forest.
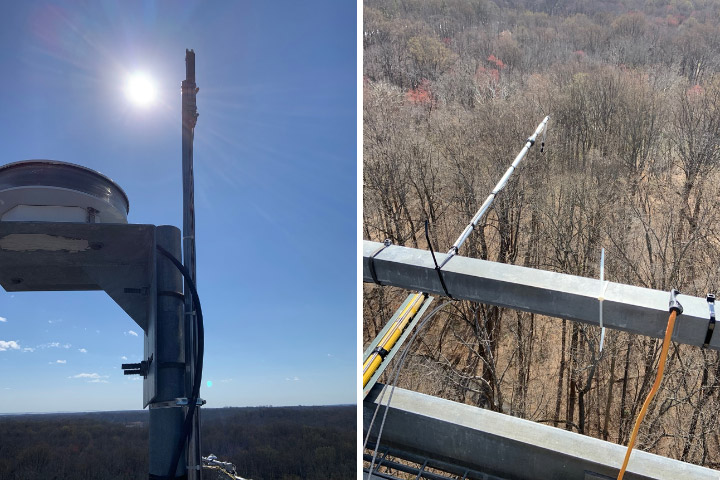
Installing the NoX on the SERC tower is just the most recent deployment by Petya Campbell and Fred Huemmrich. Over the past couple of yeavrs, they have installed similar instruments on flux towers in the arctic tundra and boreal forest.
The NoX data will be compared with the tower flux data to develop and test relationships between spectral reflectance and forest productivity and the detection of stress responses under adverse conditions. Understanding these types of relationships and how they may differ between vegetation types and season will aid the development of future NASA missions such as the Surface Biology and Geology (SBG) study, and the Geosynchronous Littoral Imaging and Monitoring Radiometer (GLIMR), which will collect spectral information similar to the NoX over large areas of the Earth.
A Powerful Landscape
Umbrella in one hand, I gripped the metal cable of the suspension bridge as I looked down into the boiling Bhotekosi River coursing below me through a steep, verdant canyon. Due to the steep slopes, fragile geology, and frequent rainfall, Nepal is especially subject to natural disasters including landslides and flooding.
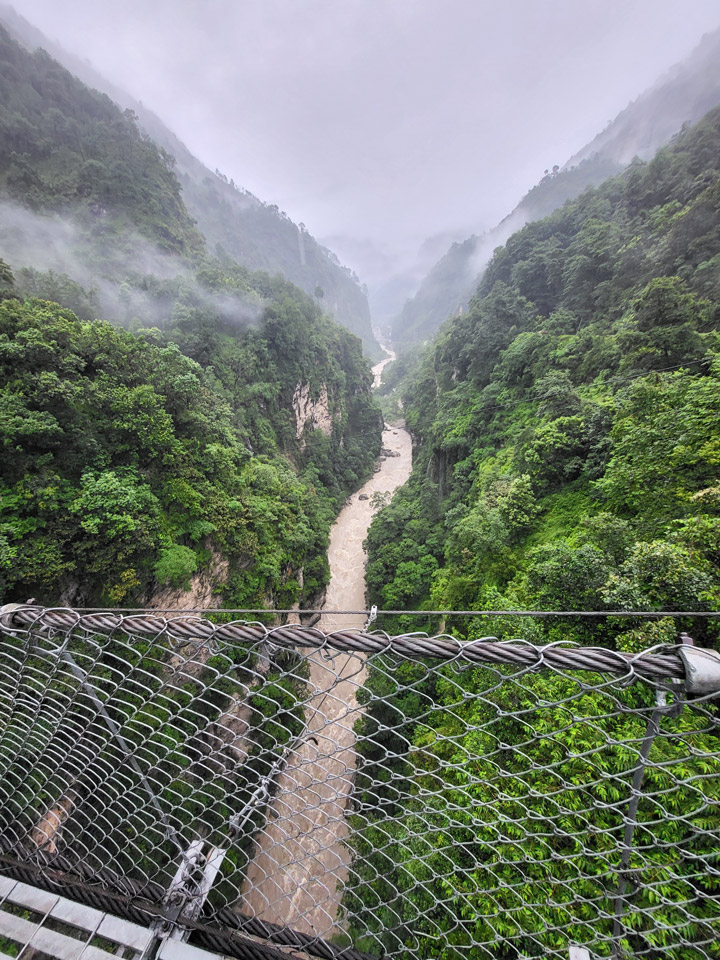
I found myself in this powerful landscape because I work for SERVIR, a joint NASA and USAID program that works with leading regional organizations to help countries worldwide use Earth observations and geospatial technologies to address environmental challenges. I joined a group of scientists and disaster risk reduction practitioners on a trip to view major landslide sites and better understand what satellite data can tell us about the landscape. Driving up from Kathmandu, we passed by small villages, hydropower plants, bulging retaining walls holding back hillsides, and the aftermath of past destructive landslides.
As an applied remote sensing scientist, I seek to understand the physical processes driving these hazards, how satellite data can capture these processes, and how the information from satellite data can complement the existing systems used for planning, early warning, and disaster response. While satellite data has the distinct advantage of consistently receiving data over large regions of the world, it is only a single perspective.
Visiting the field, talking to experts, and consulting with end users is critical to designing a product that is effective at reducing loss of lives and infrastructure due to natural hazards.
Cascading Hazards in Nepal
Cascading hazards (or ‘multi-hazards’) are events where one hazard triggers or increases vulnerability of a second hazard, such as a landslide that blocks a river and creates a flood. They pose a challenge to disaster managers since they can evolve quickly and the outcome can be difficult to predict. Nepal’s predominantly rural population is increasingly at risk as climate change drives extreme and erratic precipitation events that trigger cascading hazards.
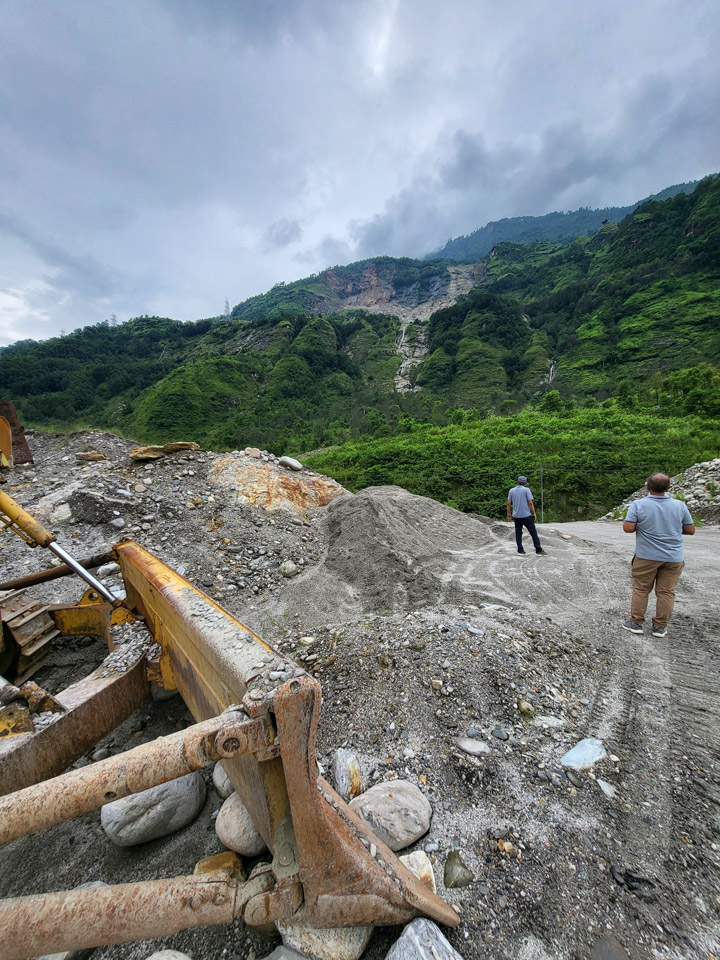
During our drive, we stopped to look at the site of the Jure landslide on the right bank of the Sunkoshi River. In 2014, the Jure landslide broke free from the steep valley walls, plummeting thousands of meters to the valley floor, blocking the river, and destroying over 100 homes and lives. The natural dam quickly caused water to back up, posing a serious flood risk to upstream towns and damaging hydropower infrastructure. The Nepal Army and Police force acted quickly to dynamite a section of the dam to release some of the water downstream, but even after this quick action the threat of catastrophic flood remained. Fortunately, a month later when the dam breached, no major damage was caused by the flood waters. In addition to loss of lives and homes, damage to the road interrupted necessary services, disrupted the primary trade route with China, and impacted the tourism trade.
In addition to precipitation events, several factors increase the chance of cascading hazards in this region: glacial lakes, snowmelt, permafrost degradation, glacial deposits, high relief, and fragile topography. The Melamchi flood disaster that occurred June 15th of 2021 was triggered by heavy rainfall at higher elevations and snowmelt. This increased amount of drainage caused a glacial lake to breach. The consequent erosion of glacial deposits and natural dams downstream resulted in severe flooding that carried debris the size of boulders and triggered further landslides and riverbank erosion.
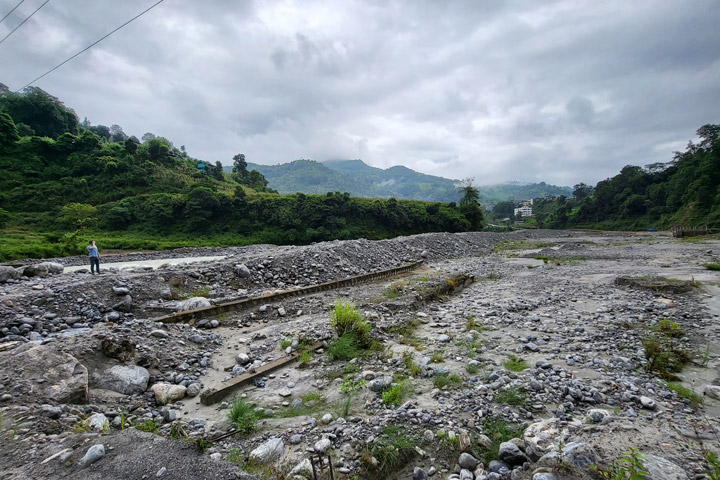
The communities here are familiar with the risk of natural hazards. They know that there is a higher risk of landslides when it rains. The current mechanisms for warning are primarily word of mouth, phone calls, text messages, and social media posts. Despite these warnings, many lives are lost during these disasters. There is still a need for an integrated multi-hazard early warning system.
The Satellite Perspective
Satellite data can be used to consistently monitor large areas for potential hazards, such as slopes at risk for landslides. Factors such as precipitation, soil moisture, slope, aspect, and even slow-motion movement can be measured via satellite and contribute to landslide hazard mapping.
NASA’s High Mountain Asia Team (HiMAT) is a group of scientists focusing on bringing the satellite perspective to these hazards. Thomas Stanley and Pukar Amatya from UMBC/NASA worked together with Sudan Bikash Maharjan from International Center for Integrated Mountain Development (ICIMOD) to develop a prototype landslide mapping and hazard awareness tool for the Karnali River Basin in Nepal. Collaborating with the National Disaster Risk Reduction and Management Authority (NDRRMA) and other government agencies, they are working to integrate the landslide hazard awareness tool into the planning and early warning process. In addition, a SERVIR applied science team is looking at how satellite radar systems can be used to monitor slowly moving slopes in the region.
The hazard awareness tool is known as Landslide Hazard Awareness for Karnali (LHASKarnali). It is a pilot project to adapt the global Landslide Hazard Assessment for Situational Awareness (LHASA) model for use in High Mountain Asia starting with the Karnali River Basin of Nepal. LHASA was previously regionalized for a SERVIR Applied Science Team project in the Lower Mekong region. It provides a one-day forecast of the hazard level for rainfall-triggered landslides by using precipitation forecasts. The LHASKarnali tool integrates forecasted precipitation from the High-Impact Weather Assessment Toolkit (HiWAT), which is managed by ICIMOD.
At a workshop prior to our field visit, we sought the insights of national stakeholders and academic experts, including the Department of Mines and Geology and the Department of Hydrology and Meteorology. Drawing from their experience assessing slope stability for high-risk communities, they felt that soil depth and soil moisture were among the most important factors controlling the occurrence of rain-triggered landslides. While satellite data can accurately provide data on slope, aspect, and rainfall, soil moisture is not well captured due to the steep slopes and high vegetation cover in Nepal. Although prior rainfall was used in LHASKarnali as a proxy for soil moisture, how this translates to soil moisture is unknown. These conversations helped end users think through the value of the tool and how their expertise could be used to enhance the end-product going forward.
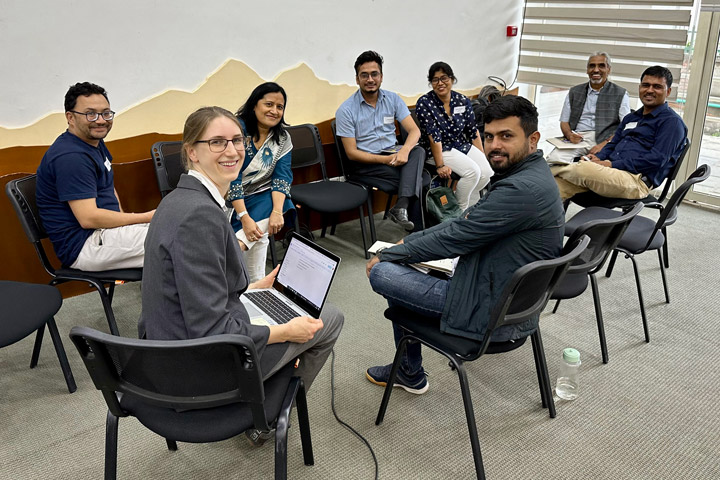
The limitations of a 4-kilometer resolution product also stood out to participants. Response agencies like Practical Action emphasized the need to be able to identify vulnerable populations at a household or village level. Even smaller landslides can be highly destructive and more targeted warnings are important when evacuations and other high effort actions are required. Going forward, a partnership between the scientists and universities will contribute to an effort to increase the resolution of the landslide hazard forecast.
Looking Ahead
During my time in Nepal, I traversed steep river canyons, which showed me the challenge of capturing and interpreting the steep slopes and narrow rivers in satellite imagery. Talking with disaster management agencies like Practical Action and NDRRMA, I learned about the need for a joint system for multi-hazard assessment to understand the cumulative effects of landslides, floods, and other factors like the erosion of natural dams. Getting the opportunity to speak with communities and get feedback about satellite observations, such as concerns over the representation of soil moisture, help us get closer to achieving warning systems for these complex hazards.
With increasing extreme events due to climate change, being able to plan and react to these hazards is critical for resilience. It will take collective expertise and tools to tackle this complex challenge.
]]>
Post a Comment